

Africa recorded $13.84 billion in energy transition investment in 2025, spread across 306 disclosed transactions in 43 countries and backed by 142 distinct investors, according to the Africa’s Power and Energy Transition Investment Report 2025 published on February 17 by Electron Intelligence, a market intelligence platform focused on Africa’s energy and power economy. The figure marks a significant data point in the continent’s ongoing energy transition — but the report’s deeper message is one of structural caution: capital in 2025 followed bankability, not ambition.
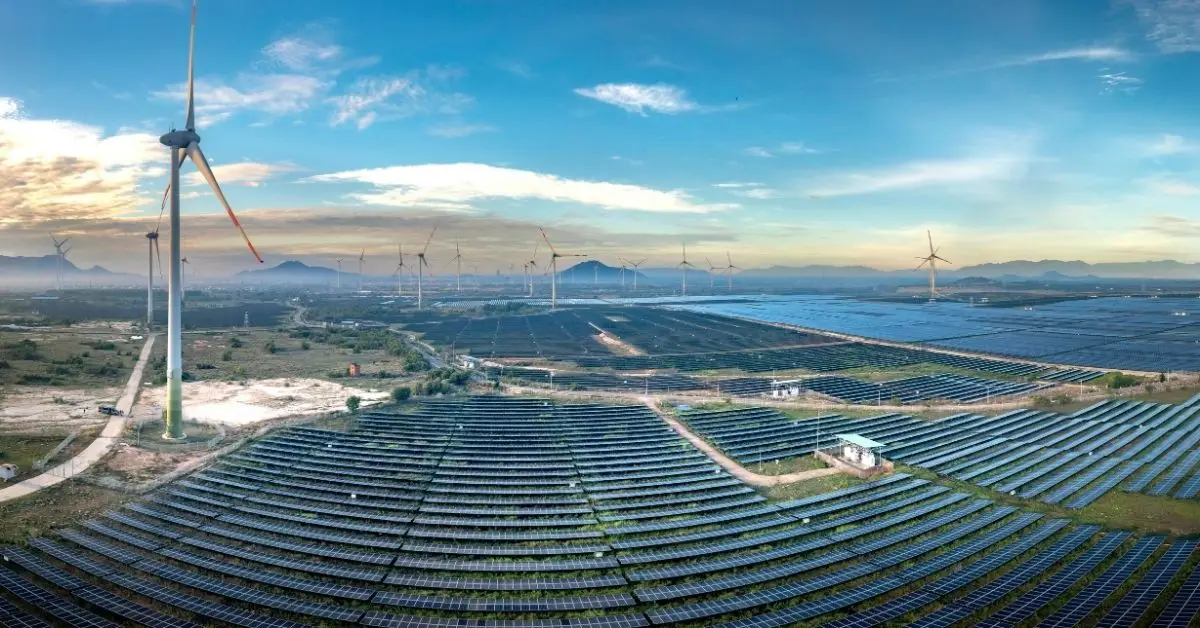
Clean energy dominated virtually all tracked investment. Of the $13.84 billion total, 98.3 percent — or $13.61 billion — flowed into what Electron Intelligence terms “Clean Electrons,” covering generation, grids, storage, energy access, and enabling infrastructure. The remaining sliver of $230 million went into fossil-adjacent or transitional activity. This distribution underscores a market in transformation, where clean energy is no longer the alternative — it is the primary destination for capital across the continent.
Yet for all its headline promise, the investment landscape in 2025 was shaped as much by what did not get built as by what did. Electron Intelligence tracked 322 projects across 47 countries representing 74,461 MW of announced generation capacity — but only 14,589 MW was recorded as actually installed during the year. The yawning gap between pipeline announcements and delivered megawatts is not a new story in Africa, but the data makes it starkly quantifiable. Mega-projects like Inga III in the Democratic Republic of Congo and large hybrid programmes continue to inflate headline capacity figures while masking the delivery bottlenecks that separate closed deals from operating plants.
Build the future you deserve. Get started with our top-tier Online courses: ACCA, HESI A2, ATI TEAS 7, HESI EXIT, NCLEX-RN, NCLEX-PN, and Financial Literacy. Let Serrari Ed guide your path to success. Enroll today.
The Bankability Imperative: What Moved Capital in 2025
According to Joseph Ibeh, Managing Director at Electron Intelligence, the investment narrative in 2025 centred on deals that could close rather than projects that simply expanded capacity targets. The report identifies a set of structural filters that determined where money flowed: credible power purchase agreements (PPAs), balanced risk allocation between public and private counterparties, proven execution capacity, and guaranteed grid access. Projects that could demonstrate these features attracted capital. Those that could not — regardless of scale or political backing — were left in the pipeline.
The report identified persistent delivery constraints across markets, including foreign exchange convertibility, revenue collection weaknesses in public utilities, grid access limitations and curtailment risk, slow permitting processes, and import and logistics bottlenecks. These factors continue to separate announced projects from those that reach financial close and construction. The implication for investors and policymakers alike is that structural reform — not simply the availability of capital — remains the primary lever for scaling Africa’s energy transition.
The tilt toward debt in the financing mix reinforces this point. Of total investment, debt accounted for $9.05 billion, or approximately 65 percent of the total, reflecting a preference for contracted cash flows and structures that can absorb currency and payment risk at scale. Equity contributed $2.48 billion, while concessional instruments — $1.17 billion in grants, $656.5 million in guarantees, and $456.9 million in blended finance — played a catalytic role in crowding in private capital where pure commercial risk appetites would otherwise fall short. The report also recorded 15 mergers and acquisitions totalling $1.4 billion, indicating selective consolidation and scaled asset acquisitions as the market matures.
Sectoral Breakdown: Generation Leads, Storage Lags
Within the clean energy total, power generation attracted by far the largest share of capital at $8.14 billion — roughly 60 percent of all clean energy investment. This reflects the fundamental reality that Africa’s energy transition is still in a build-out phase rather than a system-optimisation phase. Investors are buying capacity first and enabling infrastructure second. Sector reform programmes and public utility strengthening attracted $2.40 billion, a category that includes the policy scaffolding and institutional upgrades that determine whether generation investment eventually translates into reliable supply. Transmission and distribution networks secured $1.55 billion — a relatively modest share given that grid infrastructure is widely acknowledged as one of the sector’s most binding constraints.
Storage and flexibility projects received just $666 million, the smallest allocation across major categories. This figure signals that Africa’s energy transition remains anchored in conventional generation financing, with battery storage and grid flexibility — the technologies that make variable renewables reliable — still at an early stage of commercial deployment at scale. The report suggests the next unlock lies in networks and integrated projects, where interconnection, dispatch rules and payment security will determine whether capital can scale further.
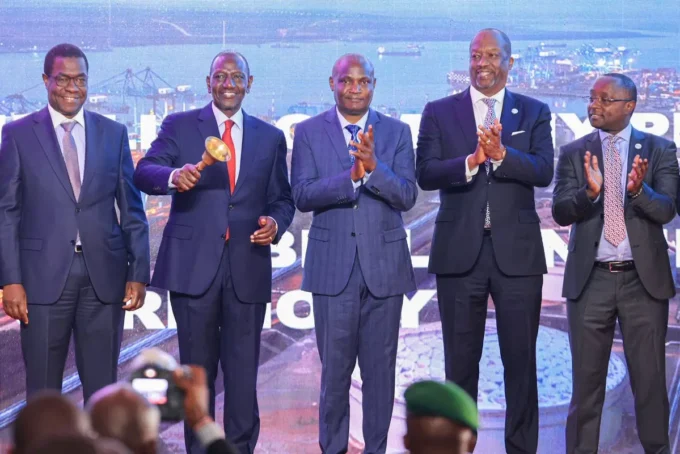
The year was anchored by several large transactions that shaped the aggregate numbers: Nigeria’s Geregu Power acquisition at $750 million, the OCP Group Green Investment Programme guarantee from Morocco at $520 million, and a $500 million African Development Bank reform package for Nigeria. These three deals alone accounted for over $1.77 billion, illustrating how concentrated investment activity remains around a handful of marquee transactions.
One decision can change your entire career. Take that step with our Online courses in ACCA, HESI A2, ATI TEAS 7, HESI EXIT, NCLEX-RN, NCLEX-PN, and Financial Literacy. Join Serrari Ed and start building your brighter future today.
Who Invested: Development Finance Institutions Dominate
Among the leading investors of 2025, development finance institutions (DFIs) dominated the rankings — a pattern consistent with a market where private capital still needs public de-risking to participate at scale. The African Development Bank (AfDB) led with $1.77 billion deployed across the continent. The World Bank Group contributed $1.04 billion, while South Africa’s Standard Bank ranked as the top commercial lender with $922.1 million — a sign that regional banks are increasingly stepping into the financing gap alongside multilateral institutions. The European Union rounded out the top four with $794.6 million.
The top ten investors together accounted for more than 53 percent of total investment, or $7.42 billion across 112 transactions in 34 countries. Such concentration is a double-edged signal: on one hand, it reflects the scale of commitment from a core group of anchor investors; on the other, it reveals the fragility of a market where removing any one major player would have an outsized impact on total flows. The AfDB’s decade-long commitments underscore this dependence — between 2016 and 2025, the bank committed $12.74 billion in investments to connect more than 28 million Africans to electricity.
The World Bank’s involvement in 2025 also reflects its broader Mission 300 ambition, an initiative aligned with the African Development Bank and endorsed by the EU in March 2025, targeting electricity access for 300 million people across Africa by 2030. The EU separately announced a €618 million package in October 2025 to support the “Scaling Up Renewables in Africa” campaign, targeting countries including Kenya, Uganda, the DRC, Nigeria, and Tanzania.
Geography of Capital: South Africa, Egypt, Nigeria, Morocco Lead
Geographically, capital remained concentrated in markets with the regulatory maturity, deal structures, and offtake frameworks to close large transactions. The top ten countries captured $9.88 billion — 73 percent of total transaction value — underscoring a bifurcation between a small club of established markets and the broader continent where investment remains thin. South Africa led all countries with $2.16 billion, followed by Egypt at $1.95 billion, Nigeria at $1.78 billion, and Morocco at $1.38 billion.
South Africa’s position at the top reflects years of structured private-sector engagement through its Renewable Energy Independent Power Producer Procurement Programme (REIPPPP), which has attracted wind and solar developers across multiple bidding rounds and created a credible offtake framework. By 2025, South Africa’s renewable capacity was contributing significantly to reducing coal dependence, though grid constraints and policy uncertainties continued to slow deployment relative to the pipeline.
Egypt’s $1.95 billion ranking reflects both its scale and the maturity of its renewables programme. The country reached 9.1 GW of installed renewable capacity in fiscal Q2 2025/2026, up from 8.6 GW a year earlier. Projects like the Benban Solar Park — one of the world’s largest solar installations — and the Kom Ombo solar PV plant have helped position Egypt as a key investment destination in North Africa. Morocco, at $1.38 billion, continued to benefit from its reputation as one of the continent’s most advanced clean energy markets, anchored by the Noor Ouarzazate Solar Complex and the Noor Midelt hybrid solar park currently under development.
By subregion, West Africa attracted the most investment at $3.91 billion, driven in part by Nigeria’s large-ticket transactions and sovereign-backed programmes across the ECOWAS bloc. North Africa followed closely at $3.75 billion, reflecting Egypt and Morocco’s outsized contributions. Southern Africa recorded $3.13 billion, while East Africa received just $797.7 million — a figure that highlights the significant under-investment in a region with strong renewable resources, particularly in geothermal and solar. Central Africa attracted the least at $325.5 million, despite hosting some of the continent’s largest potential hydropower resources. Cross-regional transactions involving two or more subregions totalled $1.90 billion.
The Structural Challenge: Africa Gets 2% of Global Clean Energy Investment
The $13.84 billion figure, while significant for the continent, needs to be placed in stark global context. The African Energy Chamber noted in February 2026 that Africa hosts 20 percent of the world’s population but receives only about 2 percent of global clean energy investment. The IEA’s World Energy Investment 2025 report found that private sector clean energy investment has tripled since 2019 — rising from around $17 billion to almost $40 billion in 2024 — but public and development finance institution funding has simultaneously fallen by approximately one-third over the past decade, reaching $20 billion in 2024, largely due to an 85 percent reduction in Chinese DFI spending.
This structural retreat of public finance, at precisely the moment when private investment is growing but remains insufficient, creates a dangerous gap. The IEA estimates that reaching universal electricity access in Africa will require investment to scale to $15 billion per year — yet tracked financing commitments currently remain below $2.5 billion per year for access-focused projects. Nearly 600 million Africans still lack access to electricity, a number that has barely declined in recent years because electrification has failed to keep pace with population growth. Fewer than 19 million people gained electricity access in both 2023 and 2024, compared with 23 million in 2019, according to the IEA.
The cost of capital compounds the problem. Investors financing a solar power plant in Kenya or Senegal charge interest rates of 8.5 to 9 percent, compared with 5 to 6 percent in Europe or North America — meaning African countries pay nearly twice as much to finance equivalent projects. Without structural reforms to reduce this premium, the investment required to close the access gap will remain significantly above what the market will organically deliver.
Looking Ahead: Networks, Policy Reform, and Scaling the Middle
The Electron Intelligence report concludes that Africa’s 2025 energy investment cycle remains firmly anchored in power and grids, with future growth likely to depend on network integration, bankable offtake frameworks, and the systematic removal of delivery bottlenecks. The continent is not short of announcements or ambitions — a cumulative $400 billion in transmission and distribution investment is estimated to be required by 2050 just to support growing generation capacity and electrification goals. The gap is between announced intent and closed transactions.
The next growth phase, the report suggests, will require investors and policymakers to focus on what lies between the headline generation projects and the last-mile access solutions: the grids, storage systems, market regulations, and payment infrastructure that determine whether new capacity translates into reliable, affordable power. Africa’s energy demand is projected to rise by more than 50 percent by 2040 under current policies, driven by urbanisation, industrialisation, and a growing population expanding at twice the global average rate. Meeting that demand with clean energy requires not just more capital but smarter capital — structured to survive the foreign exchange volatility, grid constraints, and offtake risks that define African power markets.
The $13.84 billion invested in 2025 is a record worth acknowledging. But the 74,461 MW announced versus 14,589 MW installed is a ratio worth confronting. Africa’s energy transition is advancing — but the gap between what is possible and what is bankable remains the defining challenge of this investment cycle.
Ready to take your career to the next level? Join our Online courses: ACCA, HESI A2, ATI TEAS 7 , HESI EXIT , NCLEX – RN and NCLEX – PN, Financial Literacy!🌟 Dive into a world of opportunities and empower yourself for success. Explore more at Serrari Ed and start your exciting journey today! ✨
Track GDP, Inflation and Central Bank rates for top African markets with Serrari’s comparator tool.
See today’s Treasury bonds and Money market funds movement across financial service providers in Kenya, using Serrari’s comparator tools.
photo source: Google
By: Montel Kamau
Serrari Financial Analyst
23rd February, 2026


